Interactive Genomics Research Lyme Disease: B. burgdorferi

Welcome to the Jewett Lab Interactive Genomics Portal for Lyme Disease Research.

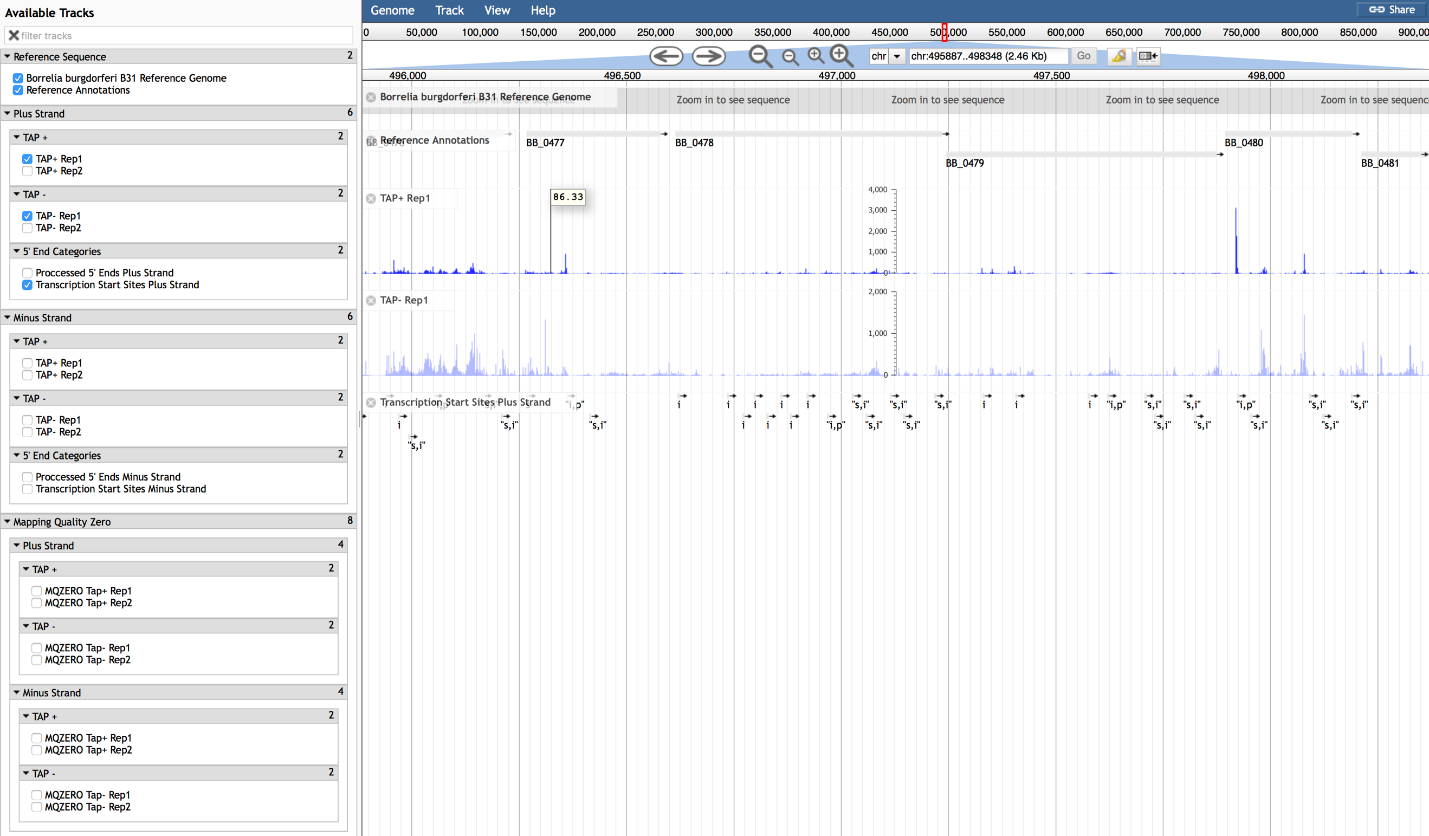
This page contains a link to the B. burgdorferi 5’ end transcriptome and instructions for navigating the dataset. Transcriptional start sites (TSSs) and processed 5’ ends were distinguished with differential application of tobacco acid pyrophosphatase (TAP) in the RNA-seq library preparations. These data will allow users to accurately determine gene boundaries, identify putative leaderless and long untranslated regions, and discover novel transcripts. For specific examples, experimental validation of the data and more information on global analysis of the B. burgdorferi 5’ end transcriptome please refer to our complete publication.

Data are displayed using JBrowse, developed by Skinner at al., 2009. (Skinner at al., 2009. JBrowse: A next-generation genome browser. Genome Research. 19:1630-1638 doi:10.1101/gr.094607.109). More information concerning JBrowse can be found here: http://jbrowse.org

Accessing the Interactive Genomics Data

Access Data

TO NAVIGATE THE INTERACTIVE TRANSCRIPTOME

  • At the left of the page is a list of buttons that allow selection of data tracks. These will automatically populate the browser in order of selection. To view the data check the B. burgdorferi B31 reference genome and annotations and the desired RNA-seq tracks.
  • RNA-seq tracks are organized by DNA strand. The data in the tracks represent normalized 50 bp reads from the 5’ end enriched libraries depicting single nucleotide resolution at the 5’ end of each read. Each treatment group (TAP+ or TAP-) was performed in biological replicates (Rep1, Rep2).
  • The analyzed 5’ end data are divided between two categories, transcription start sites and processed 5’ end. These annotations can be displayed by selecting the “Transcriptional Start Sites” and/or “Processed 5’ Ends” tracks. Note the data tracks load in the order selected, so we recommend selecting the plus-strand information first, and then follow the same format for the minus-strand information. 5΄ ends were called in coverage segments of the TAP+ and TAP- signals using a procedure which excluded peaks below a minimum threshold of 30, which corresponds roughly to a minimum of 30 reads covering a genomic position, and required a 5΄ end to be sequenced in both biological replicates. For each sequenced 5΄ end, read counts were averaged between biological replicates and the ratio of reads between the TAP+ and TAP- libraries was then calculated. Transcription start sites (TSSs) can be identified based on enrichment of 5’ ends in the TAP+ RNA-seq tracks. A 5΄ end was determined to be a TSS if the nucleotide reads were at least 2-fold higher in the averaged TAP+ compared to the averaged TAP- libraries. This is based on the notion that TAP hydrolyses phosphodiester bonds on RNA 5΄ ends and that RNA ligase has specificity to only ligate the 5΄ Illumina adapter to RNA sequences harboring a 5΄ monophosphate, thereby enriching TSSs to TAP+ libraries. The 5΄ nucleotides in the TAP+ libraries not identified as TSSs were defined as processed 5΄ ends.
  • Transcription start site classifications have been designated based on the outlined criteria. Each TSS was assigned to all of the categories for which it qualified.
    • Primary (p): located within 300 nucleotides upstream the annotated start codon of an ORF on the same DNA strand, and had the highest average TAP+ read count of all such TSSs associated with the same ORF.
    • Secondary (s): fulfilled the above criteria with respect to location but was not the TSS with the highest average TAP+ read count.
    • Antisense (as): located within or just outside, extending 100 nucleotides (nts) upstream or downstream, of an ORF on the complementary DNA strand.
    • Internal (i): located on the same DNA strand at any position between the second nucleotide of the start codon and the last nucleotide of the stop codon of an ORF.
    • Orphan (o): did not meet any of the above criteria.
  • Select the B. burgdorferi replicon you wish to examine from the pull down menu in the center of the header. Browse the transcriptome of that replicon using the arrows in the header or by clicking and dragging on any of the tracks. Alternatively, specific gene annotations can be searched by typing an NCBI locus tag (e.g. BB_0001) into the box to the right of the replicon pull down menu and select “Go”.
  • The sequence data for the plus DNA strand is always indicated in red. The sequence data for the minus DNA strand is always indicated in blue.
  • Zoom in and out using the -/+ buttons, which can go down to the nucleotide level.
  • The Y-axis scale is set to autoscale based on the local reads at the given genomic position. Slide the mouse over the peak and it will tell you the number of reads.
  • The MQZERO tracks include the analysis of the repetitive portions of the B. burgdorferi genome (i.e., sequences that map indistinguishably to multiple genomic locations). The RNA-seq data in these tracks were not filtered for mapping quality and therefore also contain a considerable number of multi-mapped reads with mapping quality zero (MQZERO). The 5’ end reads for repetitive sequences were divided equally among all possible mapping locations in the genome and are indicated at all positions. These data provide the user with putative 5’ end information for such sequences.

HOW TO CITE THE DATA

Please cite our Nucleic Acids Research Article if you use this information for publications.


Philip P. Adams, Carlos Flores Avile, Niko Popitsch, Ivana Bilusic, Renée Schroeder, Meghan Lybecker, and Mollie W. Jewett. 2017. In vivo expression technology and 5΄ end mapping of the Borrelia burgdorferi transcriptome identify novel RNAs expressed during mammalian infection. Nucleic Acids Res. 45 (2): 775-792. doi: 10.1093/nar/gkw1180.


ACKNOWLEDGEMENTS

We acknowledge the following contributors to the development of the Jewett Lab Interactive Genomics Portal: Cesar A. Rojas, Philip P. Adams and the UCF College of Medicine Health and Information Technology team Aaron Spies, Andres Calvete, Micah Marshall and Craig Anderson.


We acknowledge support from: the National Institute of Allergy and Infectious Diseases of the National Institutes of Health [R01AI099094]; the National Research Fund for Tick-Borne Diseases; the University of Central Florida College of Medicine; the Austrian Science Fund [FWF F4301 and F4308]; and the University of Vienna.